Introduction
Application performance as a topic has always remained controversial and misunderstood. Let us deal with the simple ones first. We all know how an app responds when we use it and can easily conclude about the app’s performance. However, the complex issue is how the app maker looks at the app performance. Usually the expectation is to build the app to scale to say 10 times is current performance, let us call it as x. But what is x? How do we baseline the performance (x) of an application?
Let us now dive into the riveting world of performance engineering, where the x factor reigns supreme! We easily find the response time of an app at any given time. However, it may be different for different people at different times or spaces. To completely understand the performance baseline for an app, we must expand our understanding beyond an app’s response time to include two additional metrics, throughput and concurrency.
Concurrency as a measure, it is fairly easy: the number of users who use the app at any given time. we measure the response time. But then, what is throughput?
Let us use a petrol (gas) pump as an example to illustrate the concepts of throughput, concurrency and response time while baselining application performance:
Throughput
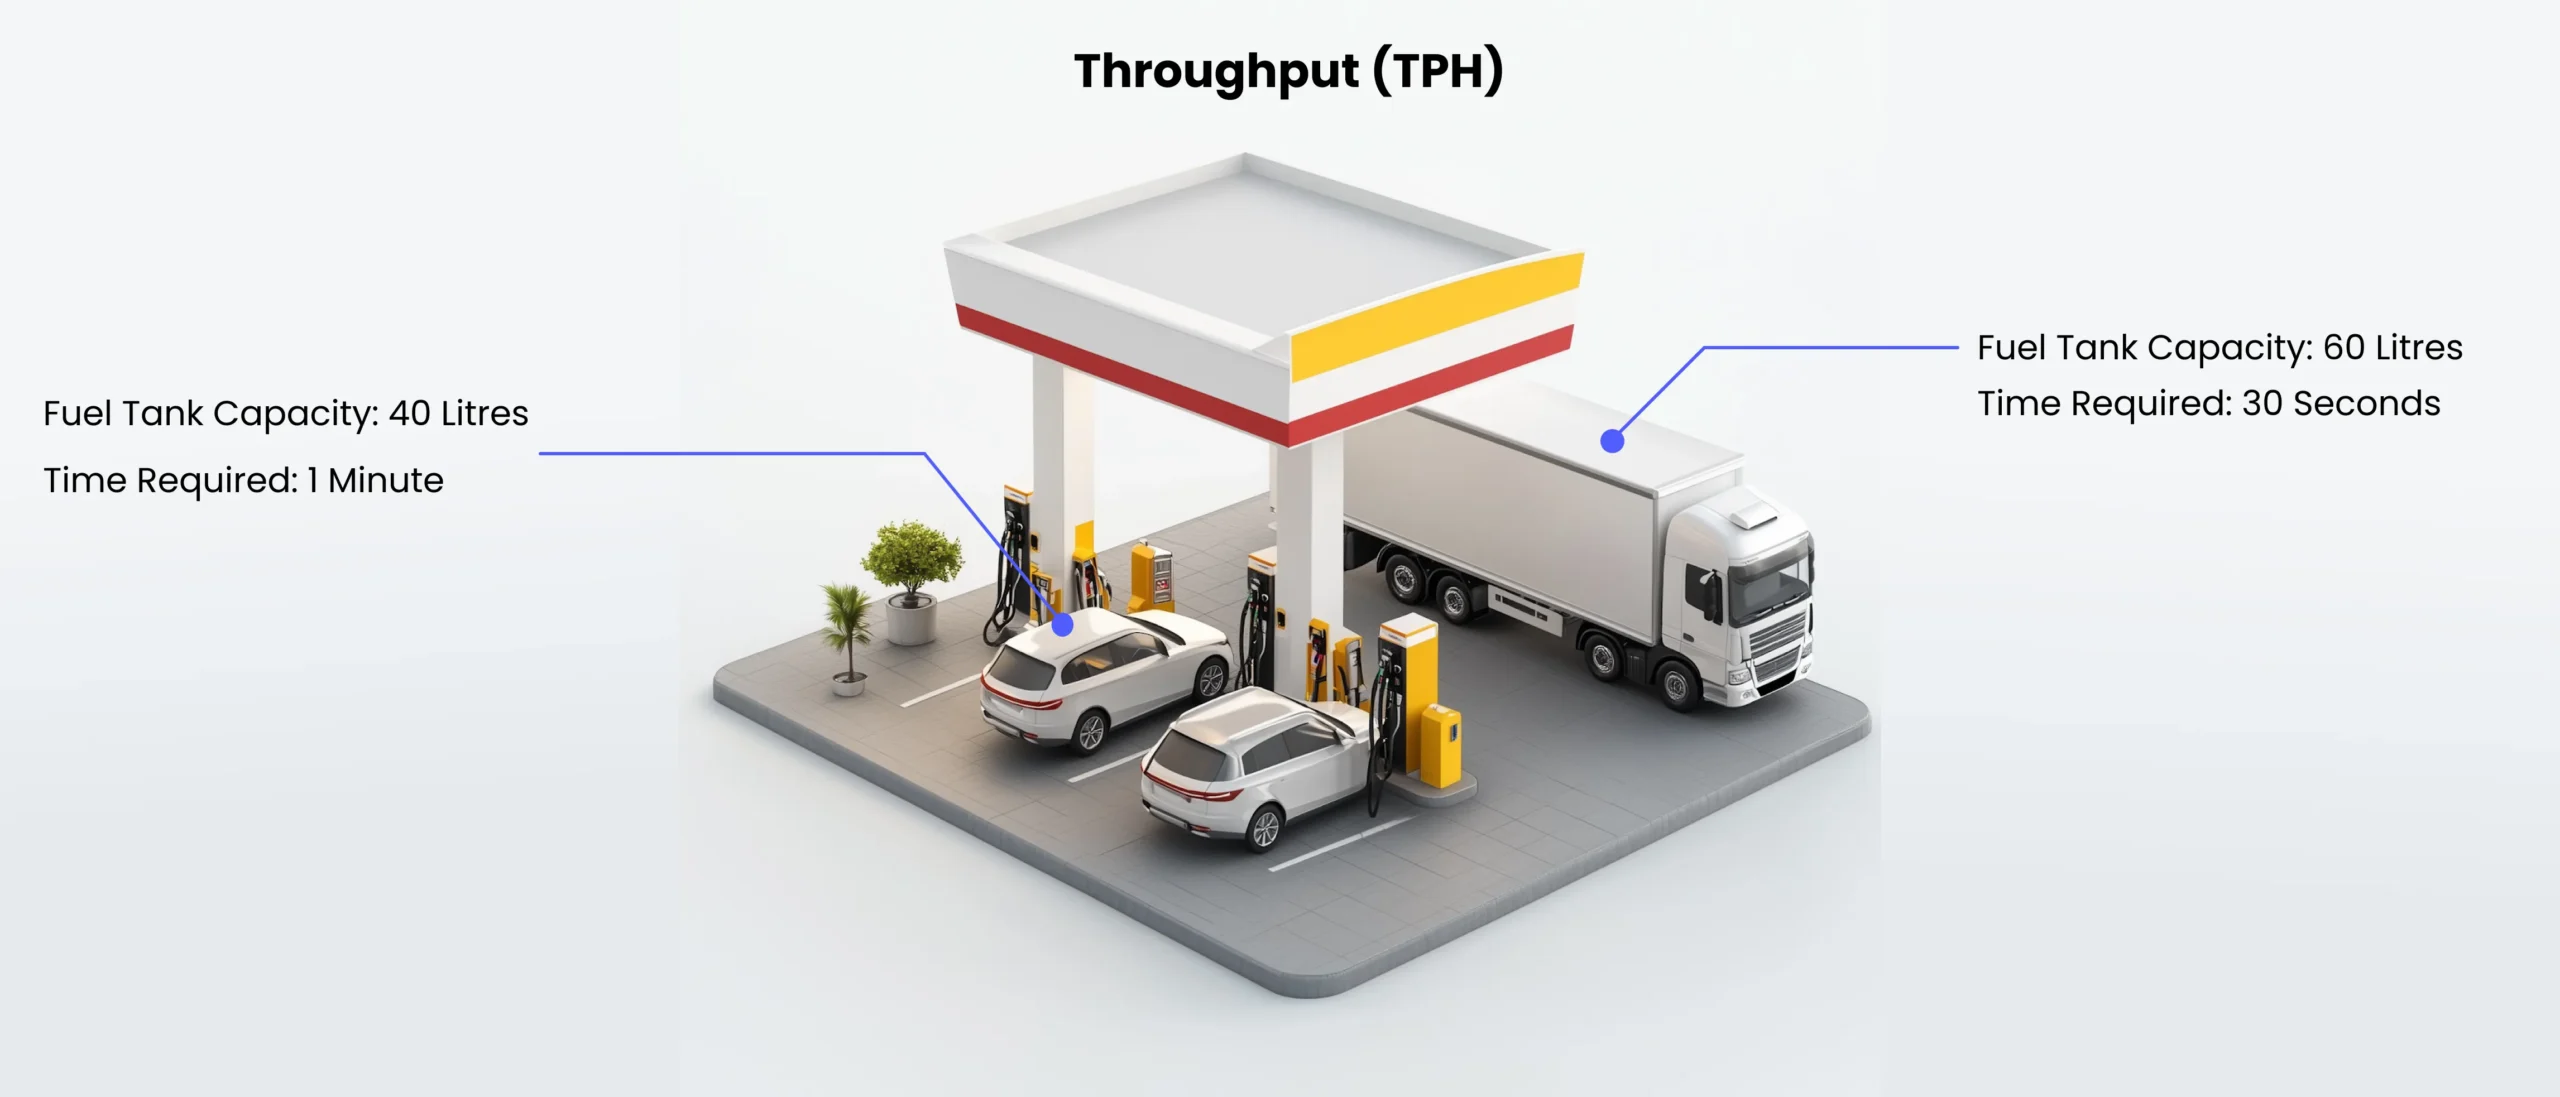
Throughput (TPH), represents the number of vehicles that can be successfully refueled within a given hour. It’s the measure of the product of the pump’s size and flow rate of the fuel that determines how many cars or trucks can be filled up in a given time, say 1 hour. A petrol pump that can fill 20 cars per hour, for instance, can be considered to have a throughput of 20 cars but the same value may not hold good when it comes to trucks that usually have higher fuel tank capacity. In the performance engineering world, this metric called throughout is mentioned differently across different tools. A throughput is measured in terms of any transaction (like car or truck) but for a single specific transaction, the same metric needs to be measured from the same tool, e.g Transactions/hour, hits/second or requests/hour.

Response Time
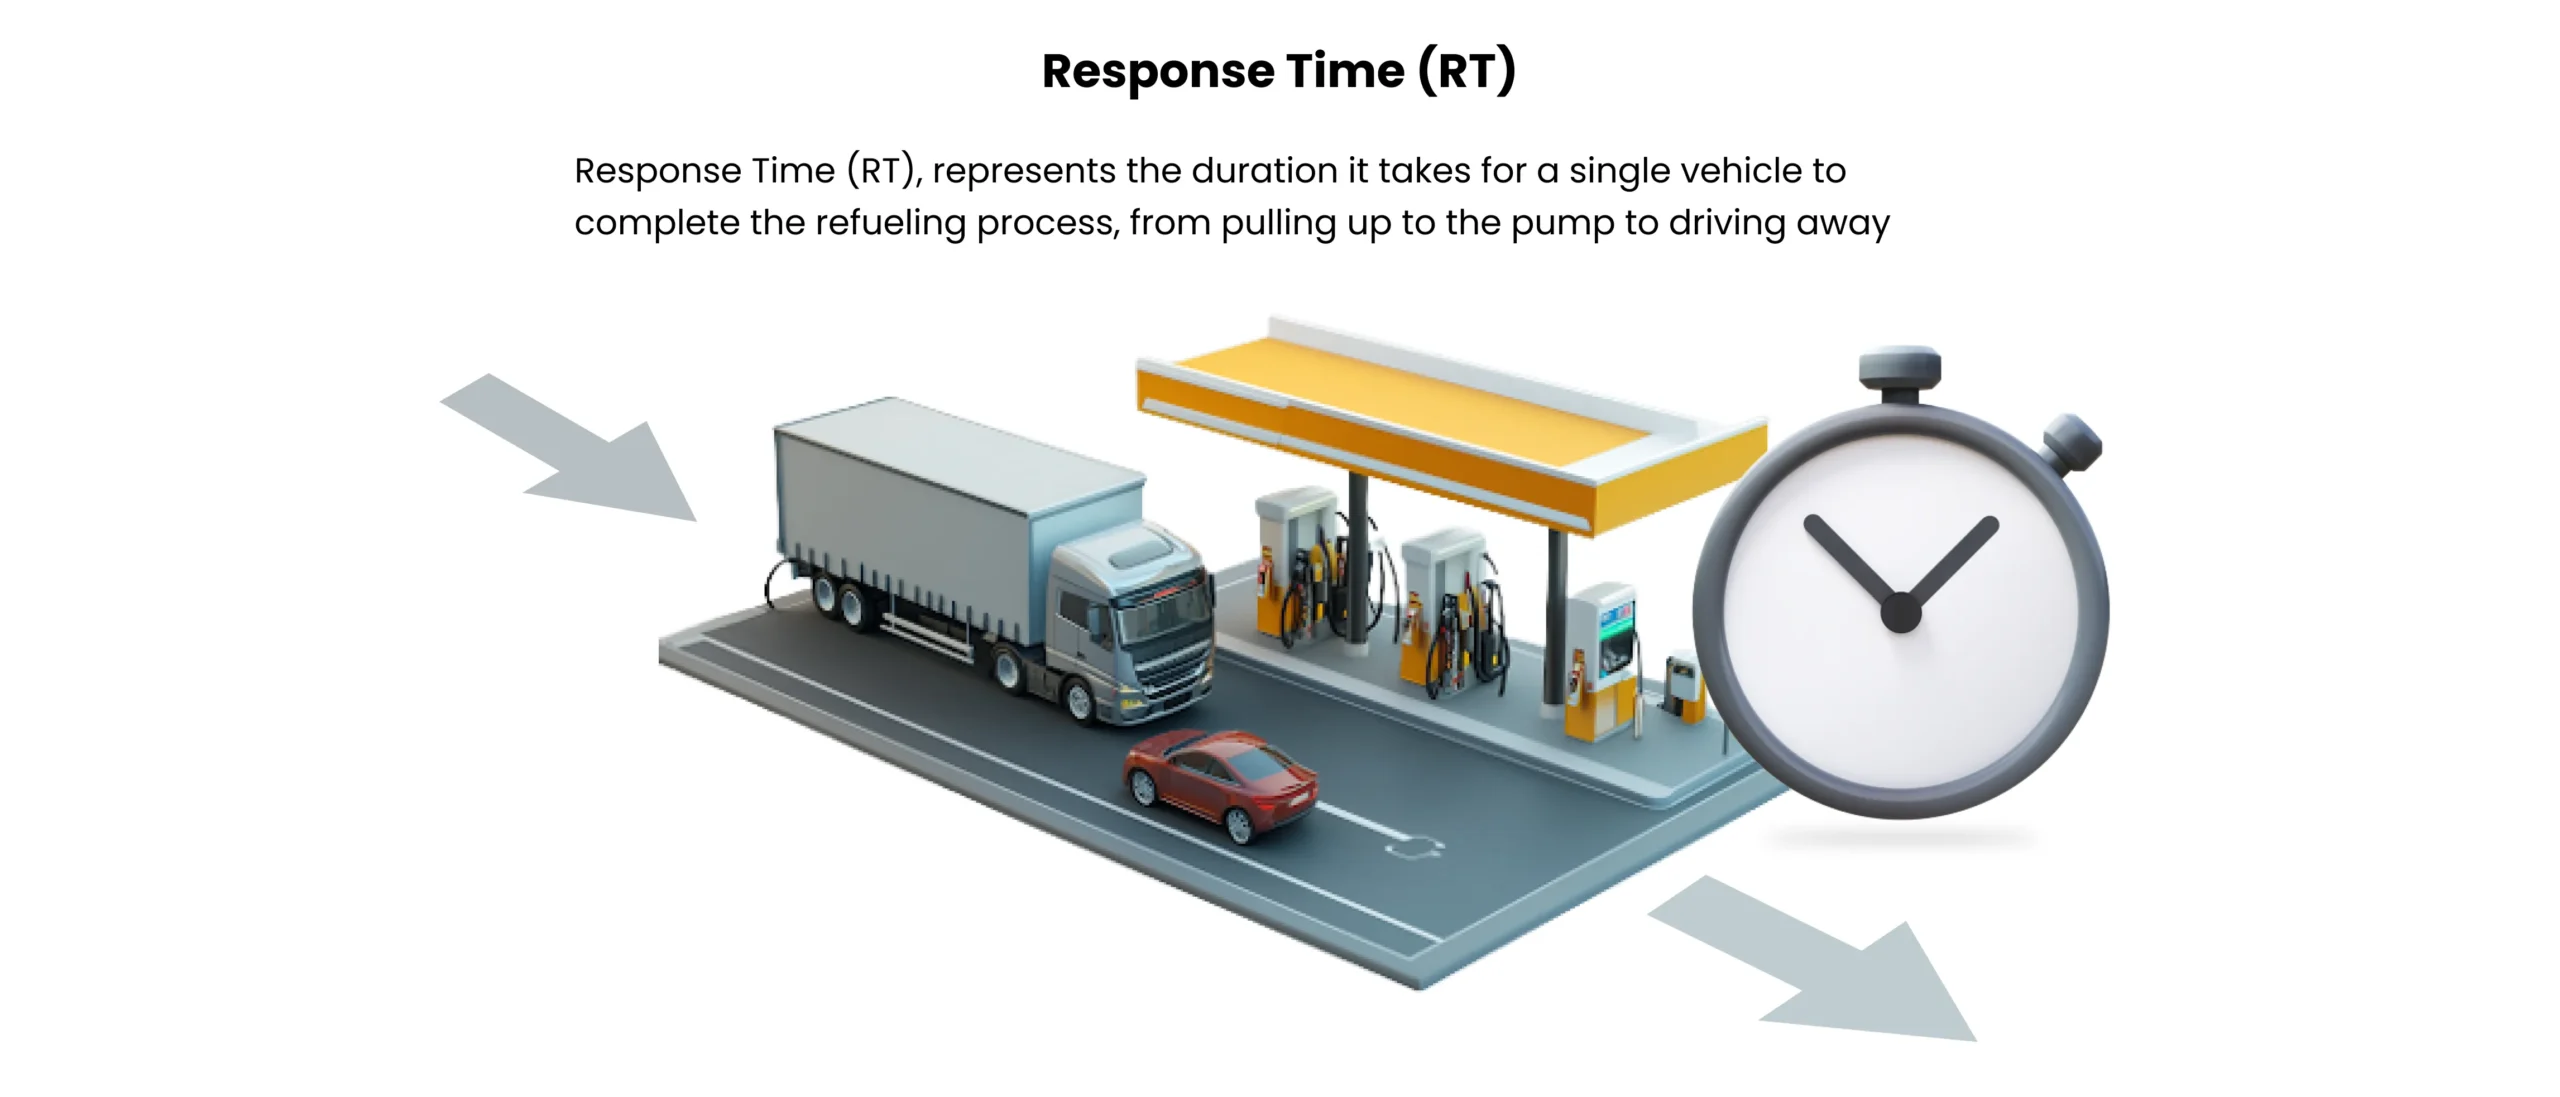
Response Time (RT), represents the duration it takes for a single vehicle to complete the refueling process, from pulling up to the pump to driving away. In the above example, since we said 20 cars per hour, the response time for a single car will be 3 mins.

User Concurrency
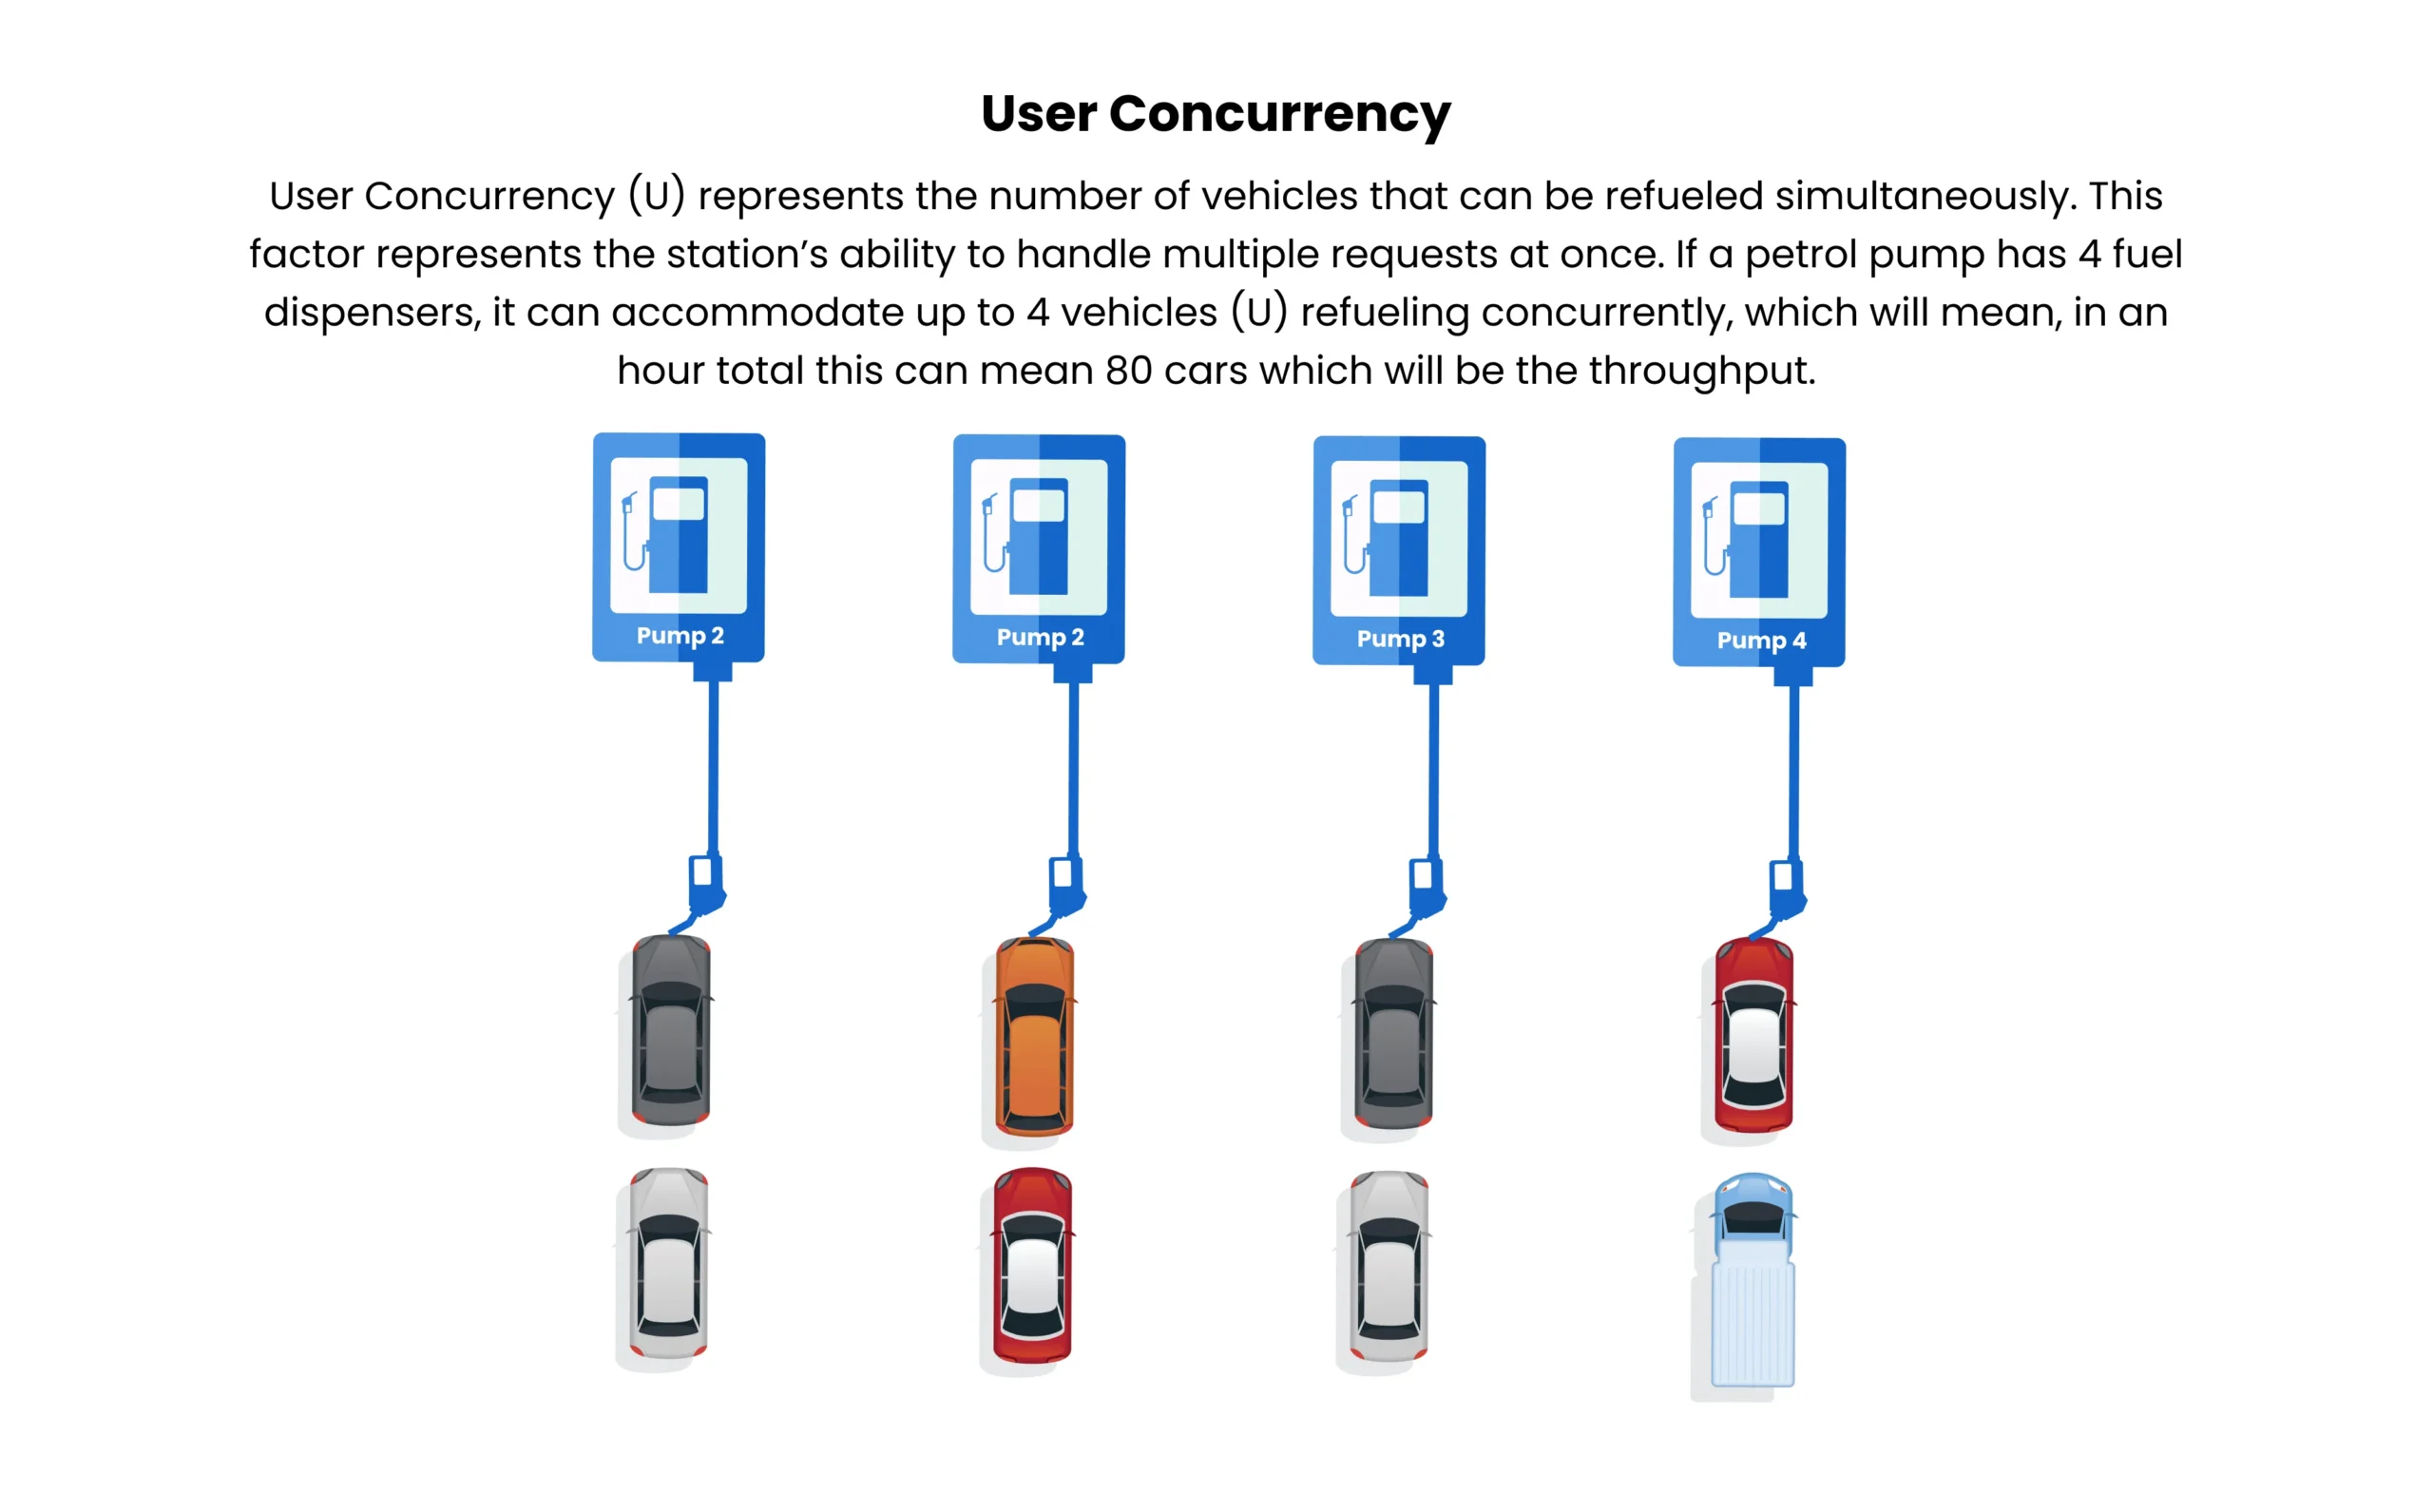
User Concurrency (U) represents the number of vehicles that can be refueled simultaneously. This factor represents the station’s ability to handle multiple requests at once. If a petrol pump has 4 fuel dispensers, it can accommodate up to 4 vehicles (U) refueling concurrently, which will mean, in an hour total this can mean 80 cars which will be the throughput.

In summary, an application performance baseline is the throughput it can handle for a given concurrency and response time. We can say this petrol station is capable of serving 80 cars given 4 cars at a time averaging 3 minutes per car.
Considering the above analogy, we come to know that this metric reflects how many requests the system handles in relation to the number of concurrent users and the response time. Let us now calculate the Performance baseline for an application in the context of any user-facing web portal (software).
Let’s consider a few scenarios now :
Scenario one
A new web application not yet deployed in production for real users:
Let’s consider the expected response time as a service level agreement (SLA) : 3 secs (any single page)
Current Concurrent User (U): Unknown, Current Response Time (RT): Unknown, Throughput(TPH): Unknown
In this case, Load tests will be conducted for the web portal where Concurrent User load will be increased systematically. During this exercise, application response time will be continuously monitored against the expected response time SLA (i.e. 3 sec.). At the point when the application response time starts breaching the expected response time SLA (3 secs), then the current concurrent user load & transactions processed in hours will be captured (which is our x factor or baseline performance).
Now we can understand the application performance for 5x, and 10x capacities and identify the need for application fine tuning and/or extra infra capacity as the case may be.
Scenario Two
An existing web application (which is already deployed in production for real users).
Let’s consider, expected response time SLA : 3 seconds (for any web page).
Current Concurrent User (U): 1000, Current Response Time (RT): 2 seconds, Throughput(TPH): 1K
Here, the Application response time is less than the expected response time.We have derived the x factor (baseline) of the application in terms of acceptable concurrent User load, Throughput (Transactions per hour) & expected Response time.
In this case, load tests will be conducted further for the web portal where Concurrent User load will be increased systematically till the time gets to the breaking point (response time breach, infrastructure utilization breach, etc.). At the given breaking point, if the application supports more than 10K concurrent users (which means more than 10X), the current infrastructure is underutilized which means the current investment in infra will need to be optimized.If an application supports less than 10K concurrent users (which means the current application/ infrastructure does not support 10 X concurrent user load), we will get to know the need for application fine-tuning and/or extra infra capacity.
Scenario Three
An existing web application (which is already deployed in production for real users)
Consider the Expected Response Time SLA : 3 seconds (for any web page).
Current Concurrent User (U): 1000, Current Response Time (RT): 5 seconds, Throughput(TPH): 1K
Here, the Application response time is more than the expected response time. We identify performance bottlenecks that are causing response time breach issues. Once application performance is improved to meet the response time i.e. less than or equal to 3 seconds, we would have derived the x factor (baseline) of the application in terms of acceptable concurrent user load, throughput (Transactions per hour) & expected Response time.
Now we can understand the application performance for 5X, and 10X capacities and identify the need for application fine-tuning and extra infra capacity.
Conclusion
Calculating the performance baseline using throughput, response time, and concurrent users provides a holistic view of application performance. By baselining these three metrics in a single reference (measuring the value of one of the metrics given the other two metrics) , you can gain valuable insights into how well your system manages requests and user interactions. Needless to mention, the metric used for throughput must be from a single tool for a single specific transaction. This approach helps in baselining performance for any application and identify performance issues or bottlenecks if there is any breach.
Author
Kapil Natu
Director-Performance Engineering


