
Based on our requirements, we need to perform the following operations on the SVG template to generate the PDF:
1. Update the dynamic text/number values in a fixed SVG template based on the placeholders within the SVG template.
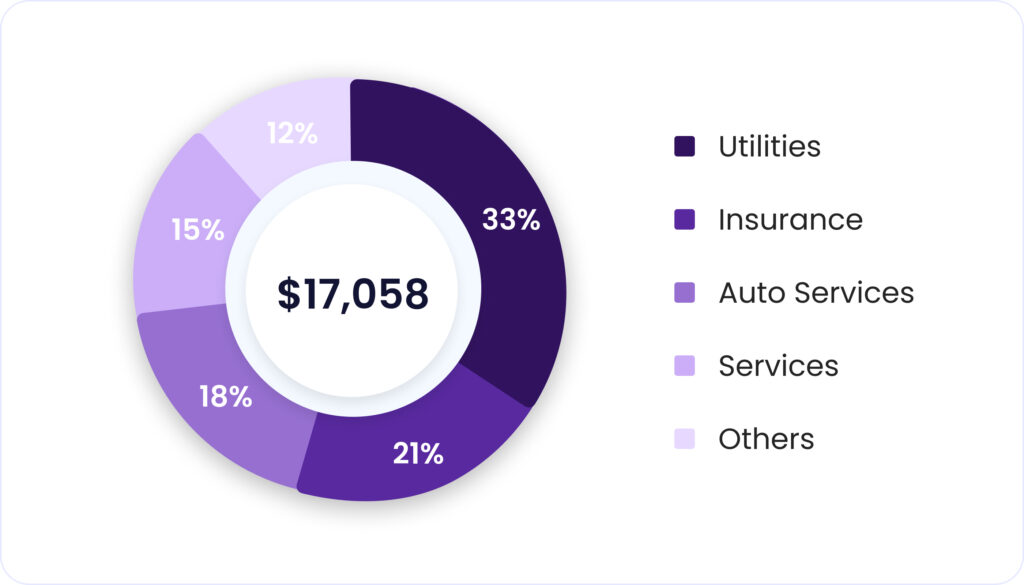
2. Generate a pie chart with dynamic values, including section values at the center of each section.
3. Generate dynamic tabular data based on user data items.
Let’s discuss each of these operations one by one:
 We found two approaches to draw the pie chart, as mentioned below:
 The primary challenge here is to accurately position each new row in its required absolute coordinate within the document. An example of such tabular data is shown below:
We addressed this challenge by creating multiple SVG templates, each with a different number of rows. For example, we had templates with one row, two rows, and three rows.
In our program, depending on the number of rows we received for a particular flow, we selected the corresponding SVG template and simply updated the text/number values as described in step 1 above.
Once the current page was filled with all the rows, we added a new page using the addPage function, using the same template as displayed above and then proceeded to append the next rows/records in the PDF.
The primary challenge here is to accurately position each new row in its required absolute coordinate within the document. An example of such tabular data is shown below:
We addressed this challenge by creating multiple SVG templates, each with a different number of rows. For example, we had templates with one row, two rows, and three rows.
In our program, depending on the number of rows we received for a particular flow, we selected the corresponding SVG template and simply updated the text/number values as described in step 1 above.
Once the current page was filled with all the rows, we added a new page using the addPage function, using the same template as displayed above and then proceeded to append the next rows/records in the PDF.
Update the text/number elements with dynamic content
 We need to update the text fields in this image.
There are two approaches you can use to update the text/number in the SVG:
Using the ID of the element and the Cheerio library:
To find the ID of the element, you can open the SVG template in any browser and use the inspect option to locate the element’s ID. Once you have the ID, you can update the text of that element using DOM manipulation libraries like Cheerio. To dynamically update all elements in the SVG, you will need to manually identify the ID of each text element or assign your own IDs. With Cheerio, you can read the stream of the template file once and store it in memory. You can then manipulate the DOM, similar to using jQuery, and pipe the final DOM. Let’s see an example.//element snippet from SVG template
<text id="id of the element" transform="translate(110 589)" fill="#004e58" font-size="25" font-family="Helvetica">
<tspan x="0" y="0"><Value of the Element></tspan>
</text>
const fs = require("fs");
const cheerio = require("cheerio");

const PDFDocument = require("pdfkit");  //pdfkit library for PDF generation
// Wrapper on the PDF kit library for SVG rendering
const SVGtoPDF = require("svg-to-pdfkit");

const template = await fs.readFileAsync(pathToTemplate, "utf8"); //you can load the template only once during application start up, to save the expensive file I/O operations.

const $ = cheerio.load(template);

// parsing the input data into the template by updating the SVG //markup
const inputData = <object with key value pairs>
const inputDataKeys = Object.keys(inputData);
inputDataKeys.forEach((key) => {
const idOfTheElement =  key;
(idOfTheElement ).html(inputData[key])
});

// this generates the document from SVG Template
var doc = new PDFDocument();
SVGtoPDF(doc, $("body").html(), 0, 0, { preserveAspectRatio: "true" });
Update the placeholder values inside the function and return the SVG template:
We chose this option over the previous one as it was simpler and worked well for us. You can load the entire SVG template inside a function and update the text/number placeholders by passing the input data. To update the values, add a placeholder wherever you want to make the changes within the template. You can use the same method mentioned in the previous approach to locate the element, or you can directly search for the text value within the SVG template and replace it with the placeholder.function getSVG = (inputData) => {
//element snippet from SVG template
return `
<text transform="translate(110 589)" fill="#004e58" font-size="25" font-family="Helvetica">
<tspan x="0" y="0">${inputData.value 1}</tspan>
</text>
<text transform="translate(110 589)" fill="#004e58" font-size="25" font-family="Helvetica">
<tspan x="0" y="0">${inputData.value 2}</tspan>
</text>
`
}
Generate a pie chart along with the section values at the center of each section
We found two approaches to draw the pie chart, as mentioned below:
- Manually draw the pie chart
- Use the d3 library.
Manually draw the pie chart using the <circle> tag/component:
Using the <circle> tag, we drew the pie chart primarily by setting the stroke-dash array property.<circle
r=<value> cx=<value> cy=<value>
stroke=<section color> fil=”transparent”
stroke-width=<value>
stroke-dasharray=”calc(<section value> * (2*3.14*r)/100) calc(2*3.14*r)”
transform=”rotate(-90) translate(-50)”
/>
Using the d3 library to draw dynamic charts:
With the d3 library, drawing the pie chart becomes easier as it requires fewer manual calculations on our part. We can utilize the arc function for this purpose. To draw a pie chart using the arc function, we need to define the inner and outer radii and the color codes for each section. Code snippetimport * as d3 from 'd3';
import * as jsdom from 'jsdom';
const arc = d3.svg.arc().outerRadius(outerRadius).innerRadius(innerRadius);
const JSDOM = jsdom.JSDOM;
const dom = new JSDOM('');
dom.window.d3 = d3.select(dom.window.document); //get d3 into the dom
const svg = dom.window.d3
.select('body')
.append('div')
.attr('class', 'container') //make a container div to ease the saving process
.append('g')
svg.attr('transform', 'translate(325.77, 1260.77)'); //adjust the translate values as per the pie chart position in the template
const arcs = svg
.selectAll('.arc')
.data(d3.layout.pie()(dataValues)) //for eg. [10,20,20,50]
.enter()
.append('g');
//create arcs for each section
arcs.append('path').attr({
class: 'arc',
d: arc,
fill: function (d, i) {
return colours[i];
},
stroke: '#fff',
});
//append text value inside each section with specific properties such as fonts
arcs
.append('text')
.attr({
'font-size': '25',
fill: '#fff',
'font-family': 'Helvetica',
transform: function (d, i) {
const value = arc.centroid(d);
value[0] -= 20;
return 'translate(' + value + ')';
},
})
.text(function (d) {
return d.data + '%';
});
//return the generated SVG code
return dom.window.d3.select('.container').html();
Reference link for learning more about the d3 library and pie chart here
Rendering the tabular data with a varying number of rows
Generate the PDF
After generating the SVGs for all the pages, you will need to combine them and generate a single PDF file. Finally, you can send the PDF file as a response using an API.const pdf = new PDFDocument({ size: 'A4', autoFirstPage: true });
pdf.info = { Title : <pdf title> };
//append all the SVGs in svgPages array which is of type string array
const svgPages
let count = 1;
for (const page of svgPages) {
//add new blank page when previous page gets filled
if (count++ != 1) pdf.addPage();
//convert SVG to PDF
SVGtoPDF(pdf, page, 0, 0, { preserveAspectRatio: 'true' });
}
res.writeHead(200, { "Content-Type": "application/pdf" });
// Piping the response
pdf.pipe(res);
pdf.end();
Conclusion
In this blog, we covered three main use cases to render reports.- In-place updation of values
- Charts
- Rendering lists of elements